Project 1 – Exploring an energy dataset.
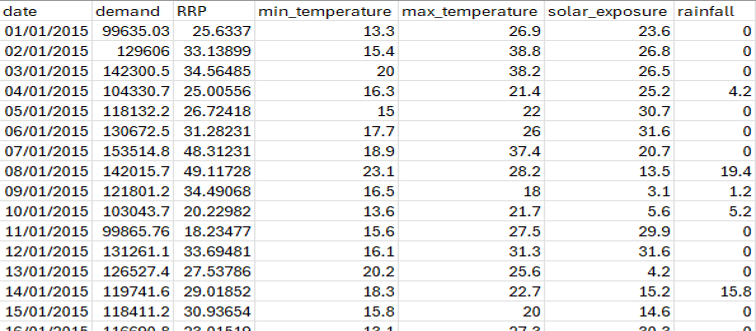
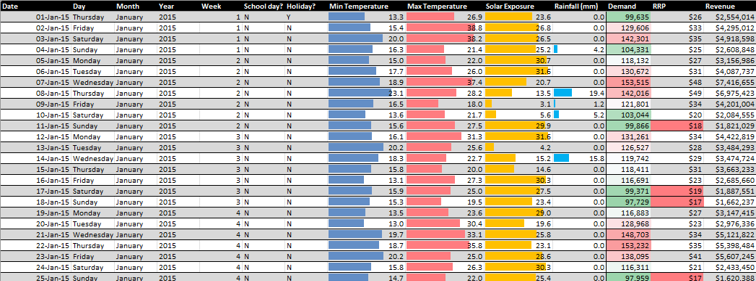
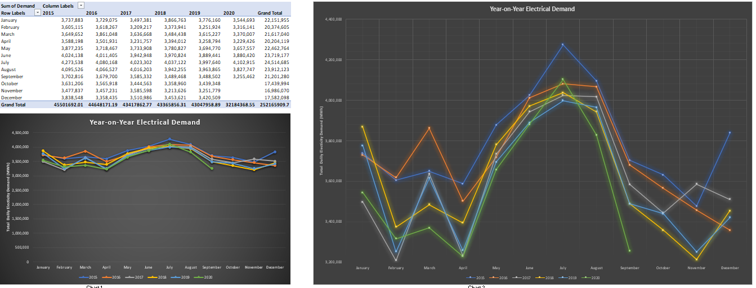
Environmental conditions affecting energy demand were analyzed using Microsoft Excel, revealing key predictive factors through thorough data analysis and modelling.
Project 2 - Create a Dashboard Meeting Business Requirements.
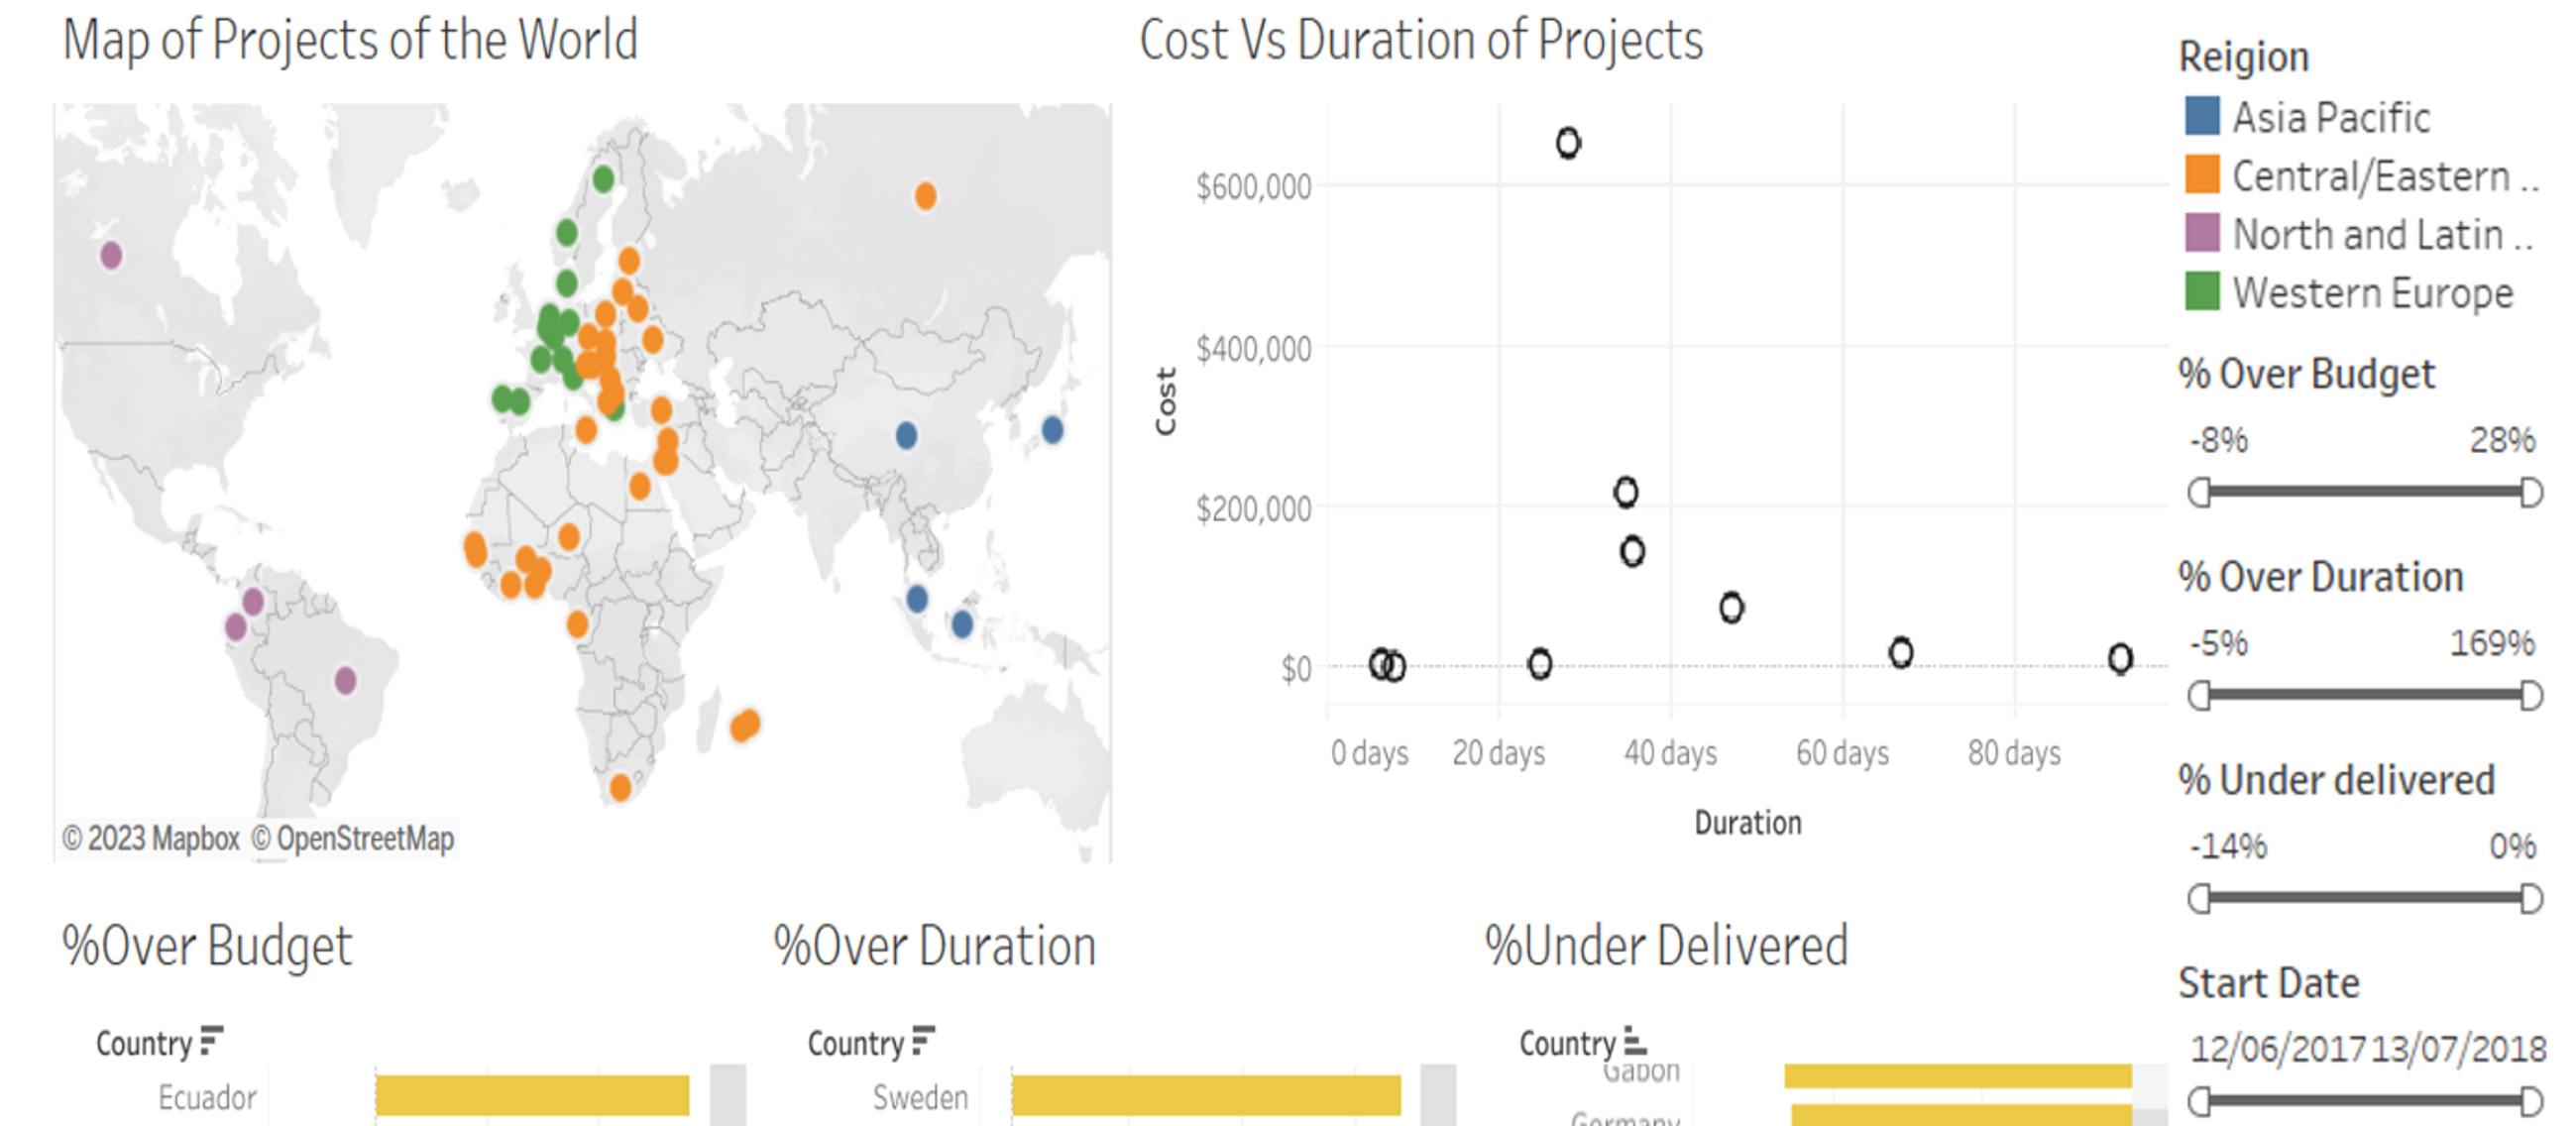
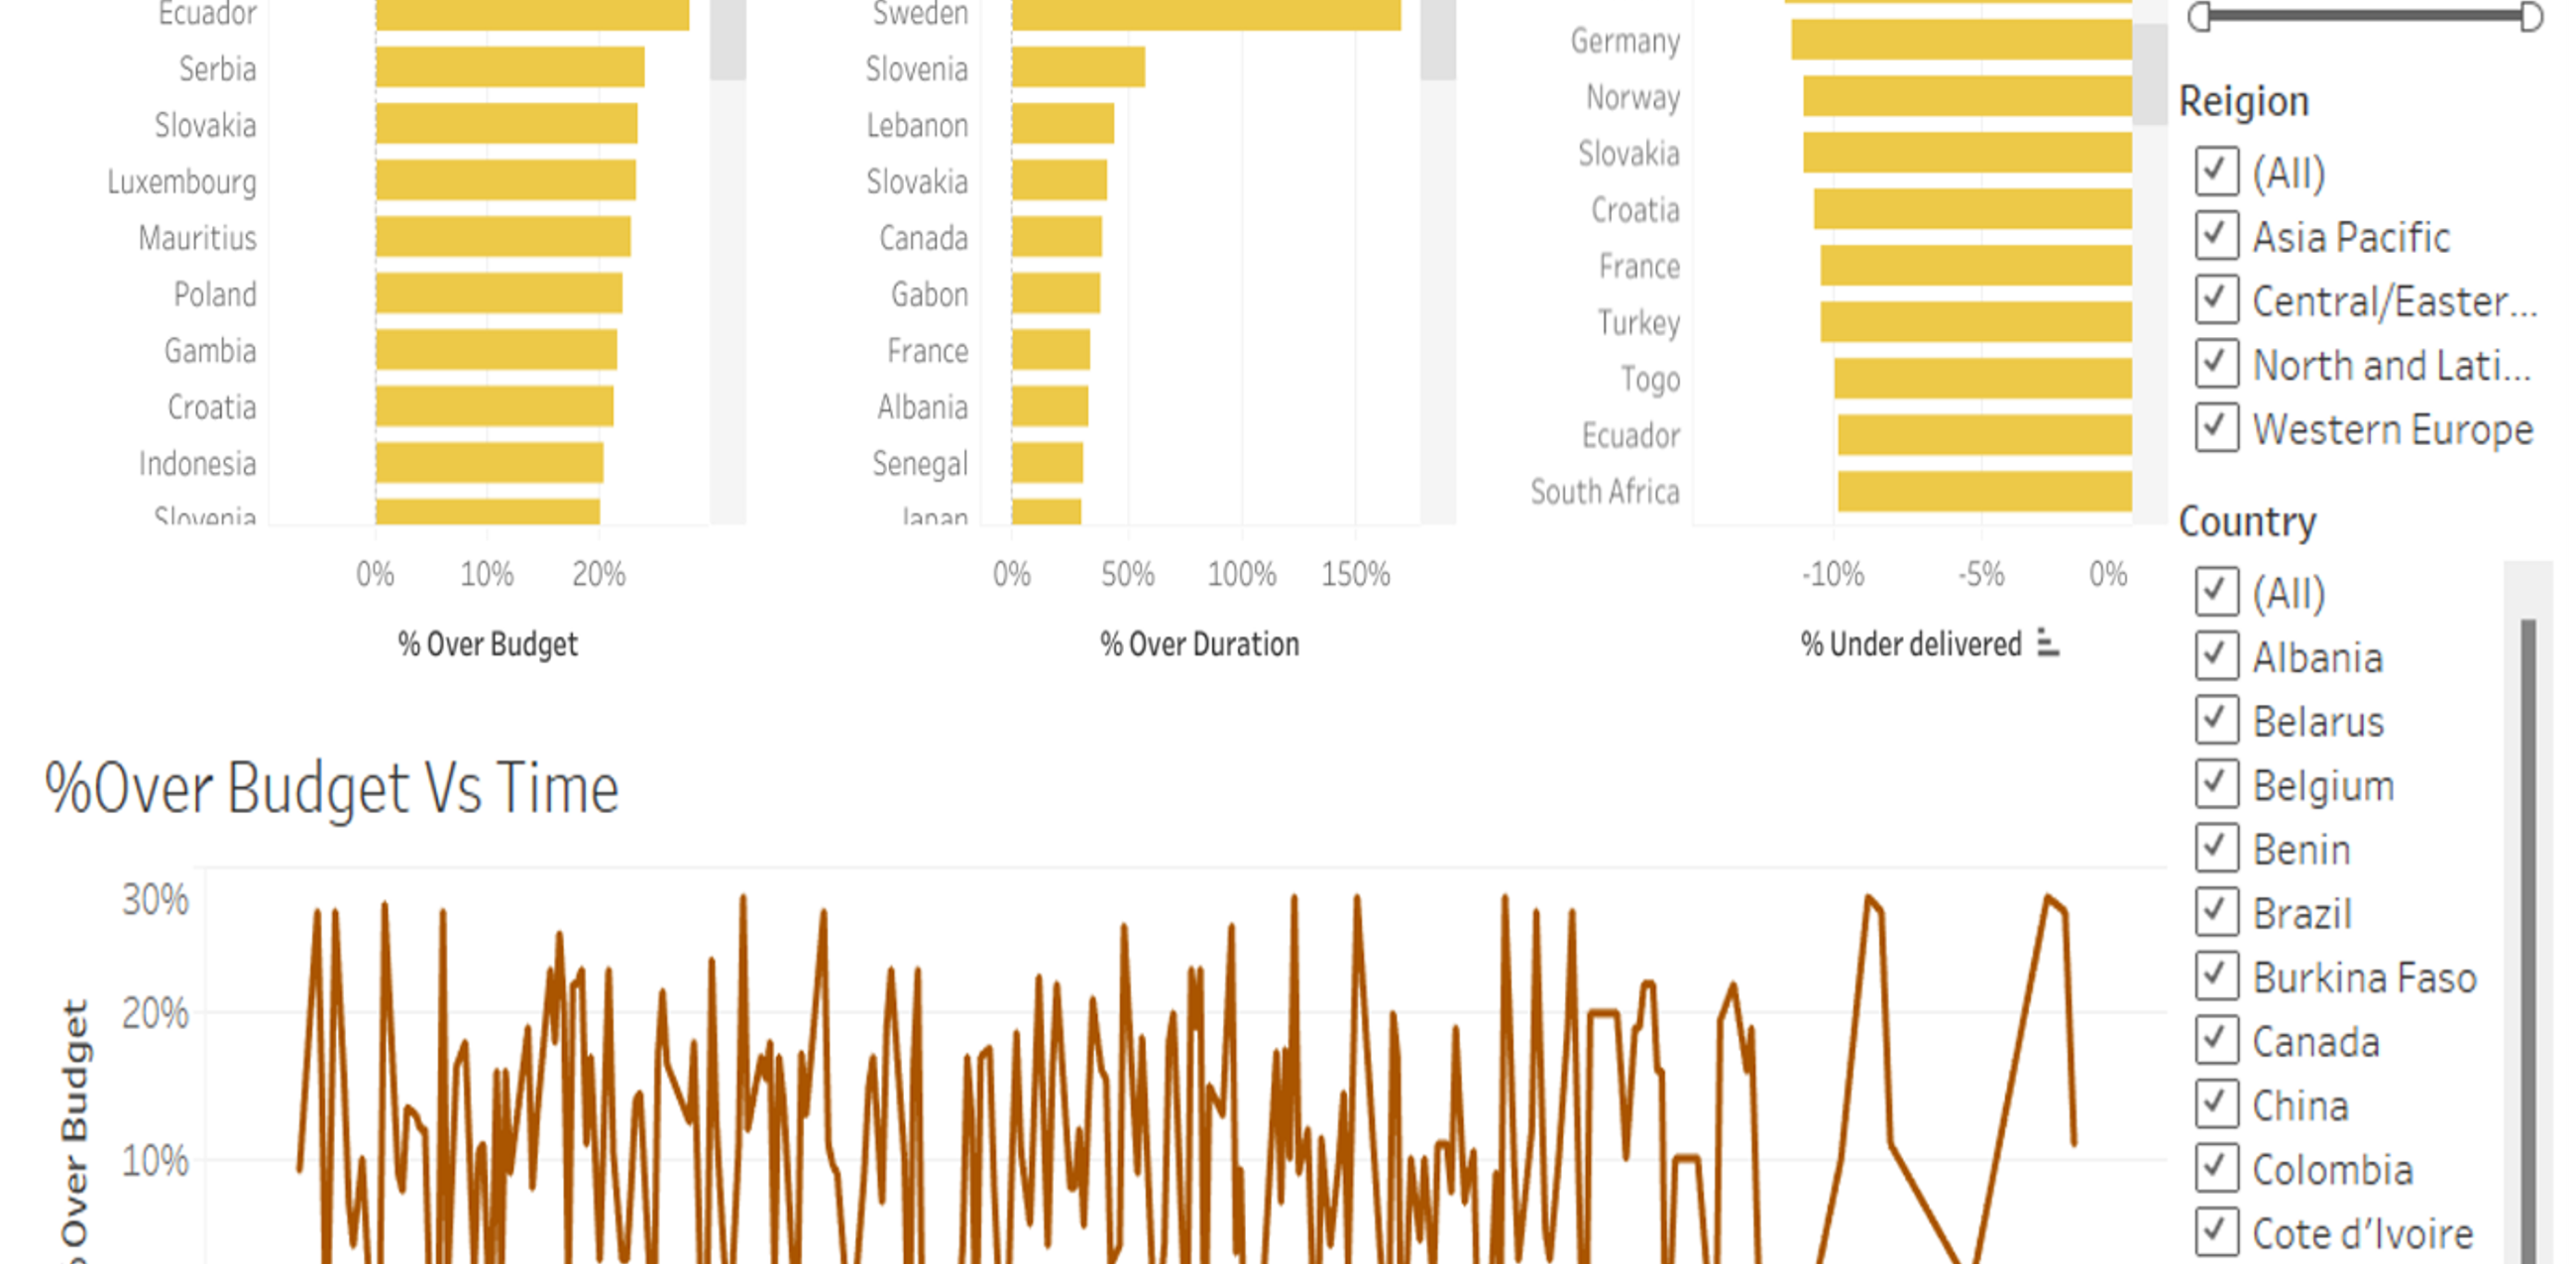
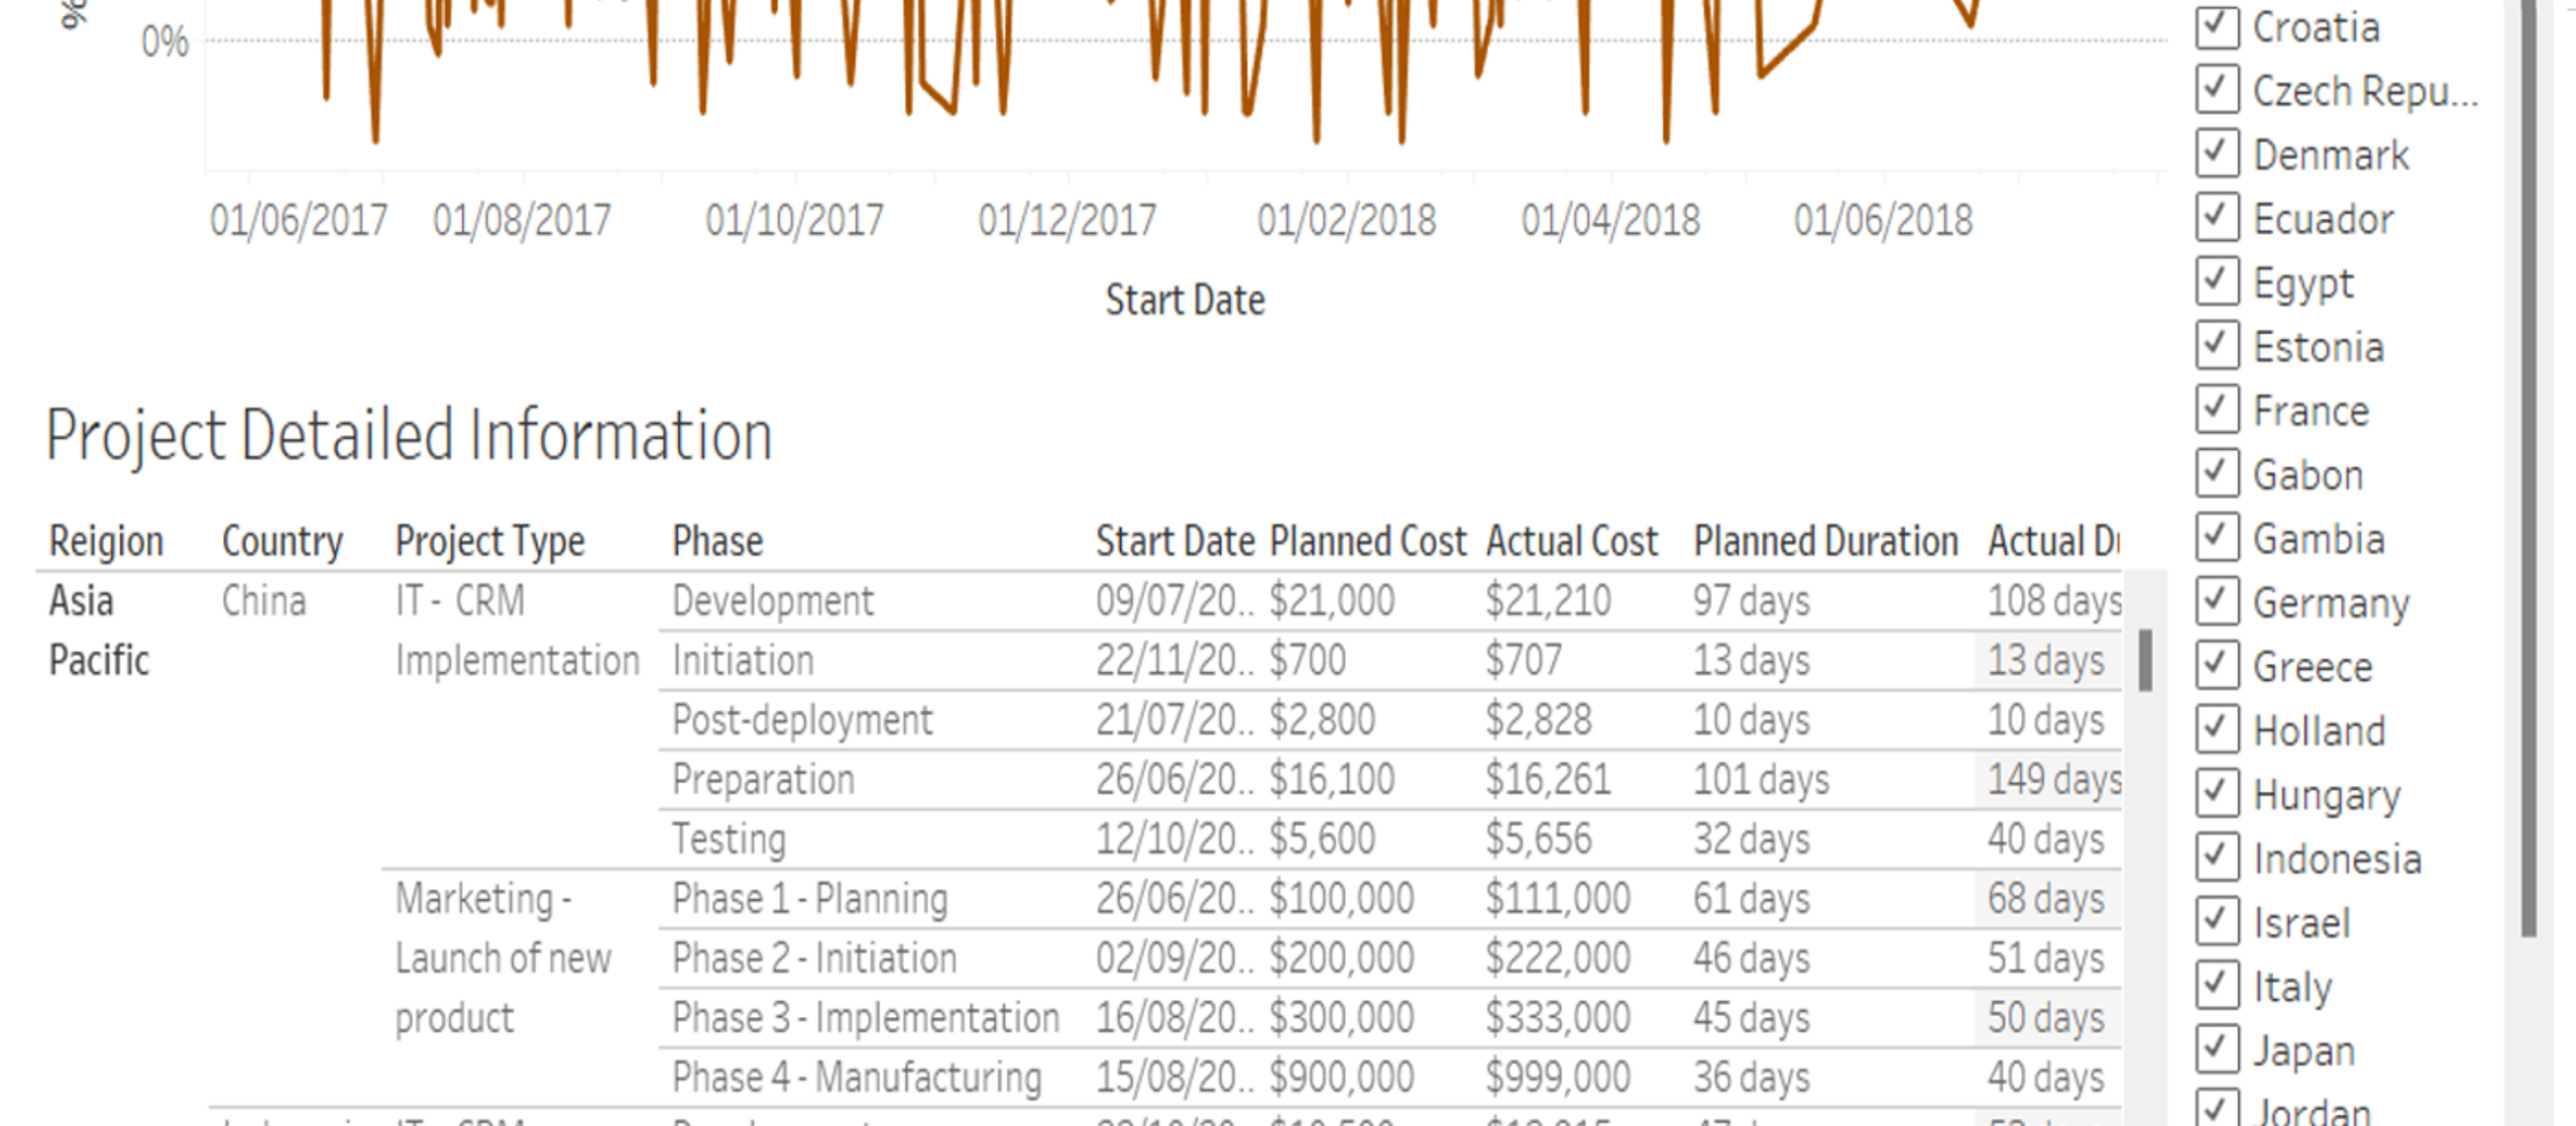
A dashboard created using Tableau to visualize the performance of over 100 projects across 4 regions. Displays key KPIs with additional visuals to aid stakeholders in decision making.
Project 3 – Another exploration.
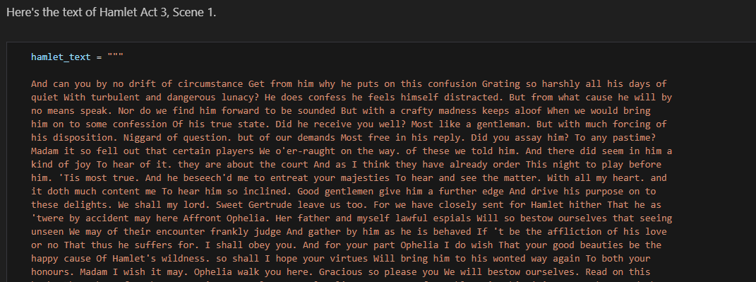
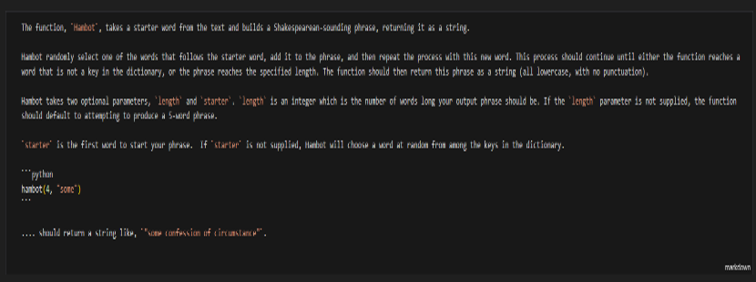
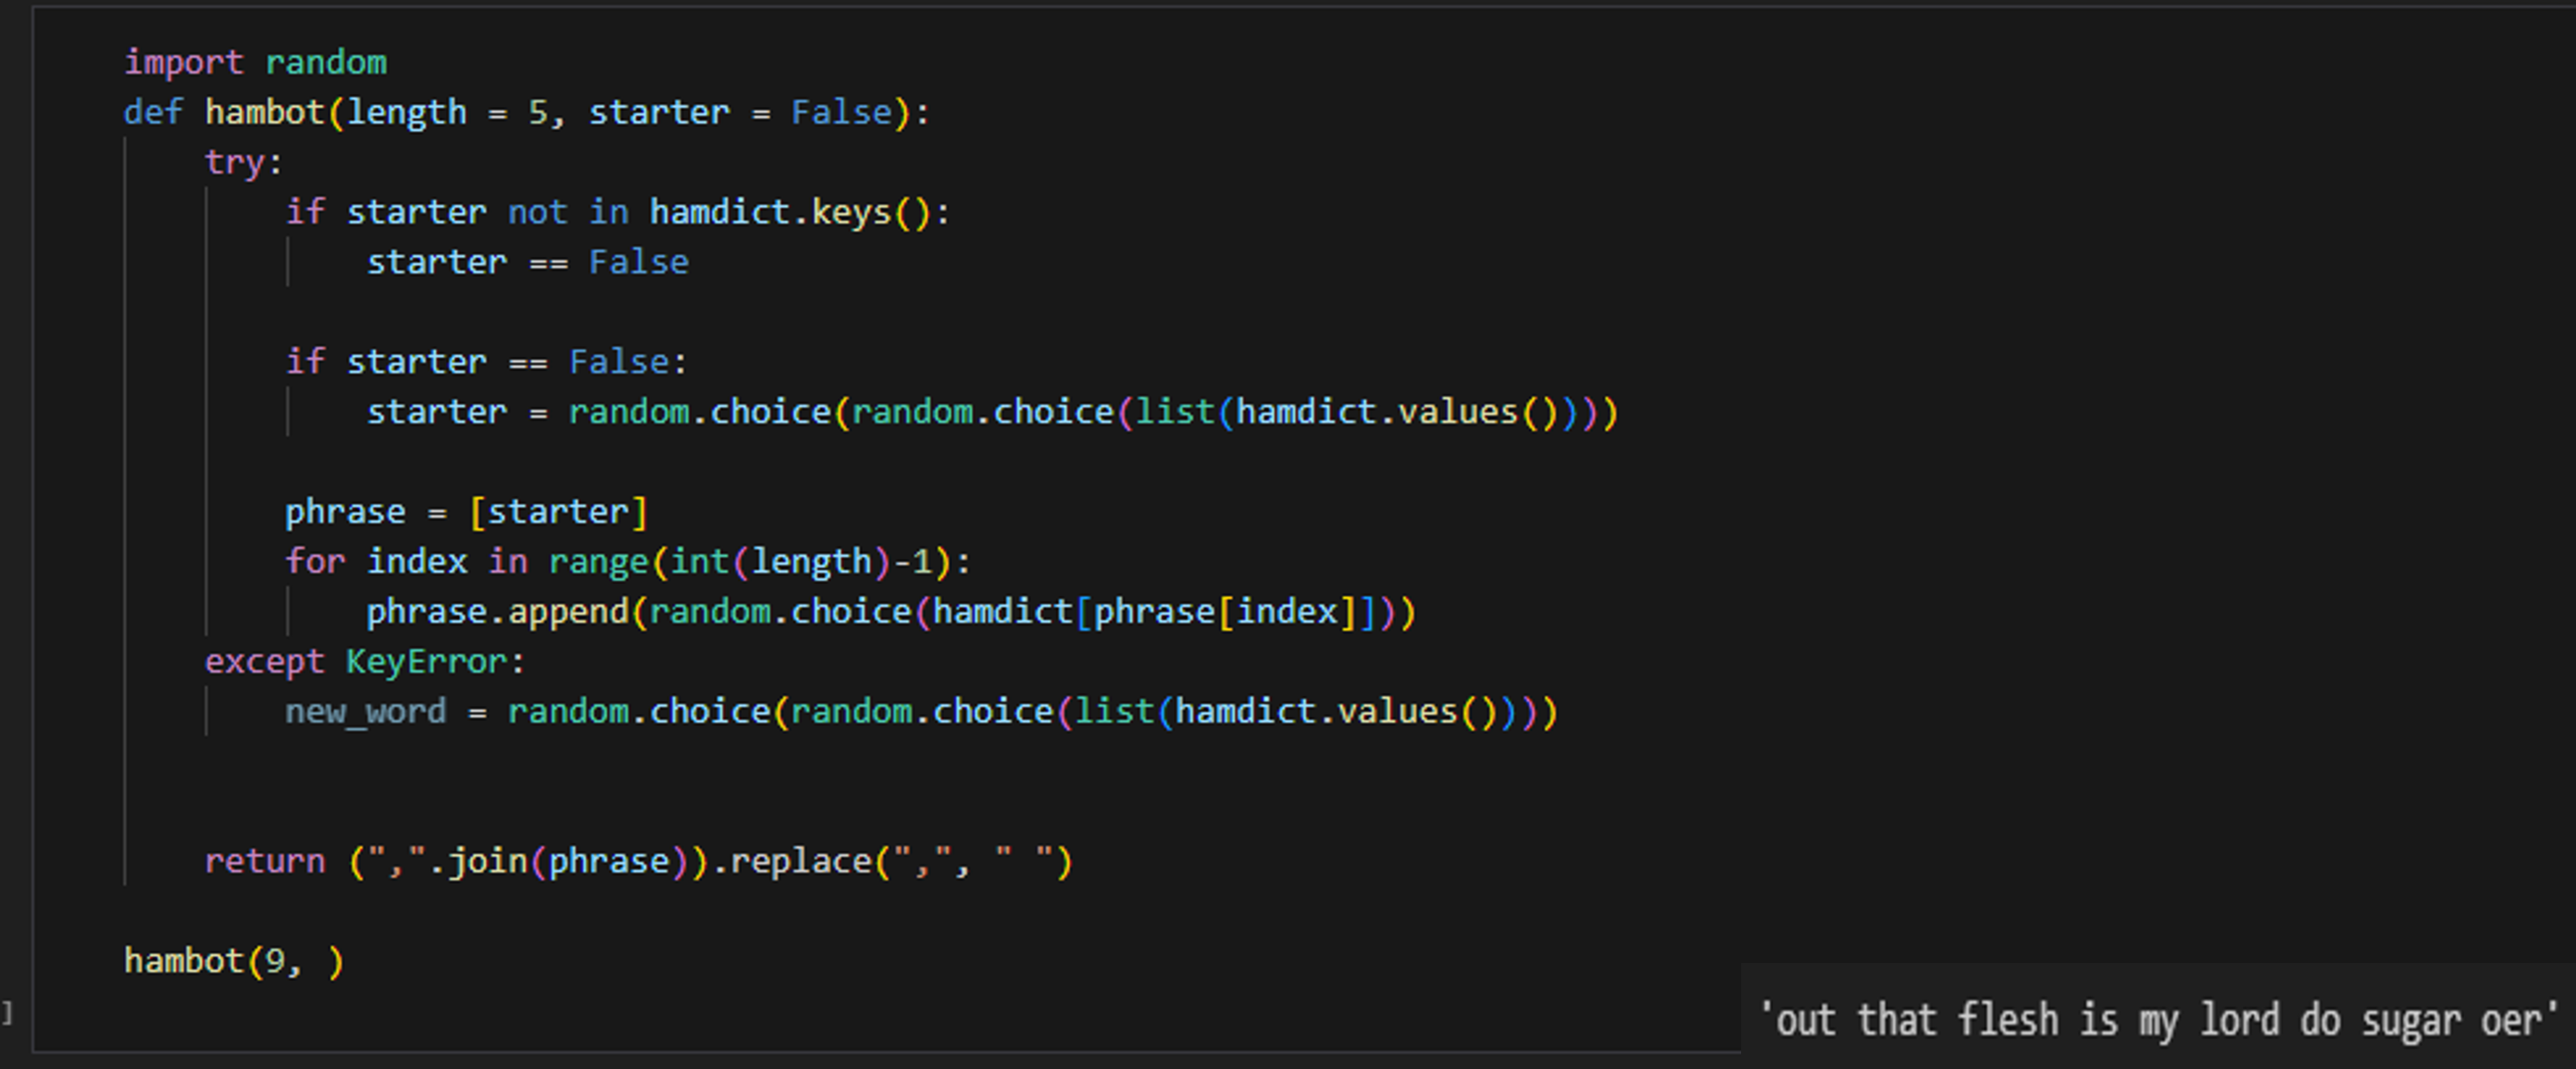
a Python function that generates Shakespearean-style sentences based on user input, utilizing NLP (Natural Language Processing) techniques.